Apache Ant is a pure-Java build tool that made quite a splash in its day, and did a great job superseding the Make tools.
Do people still use Ant? Many have moved to Maven or Gradle, but Ant has been around long enough that some projects have built quite complex structures of targets.
XML files that stretch into several hundreds of lines long, with calls and dependencies, can make understanding the Ant build script difficult enough, and maintaining it all the more challenging.
Any time I have had to modify a complex build file, I would start by sketching the targets and their relationships. This Eclipse plug-in does all that tracing and sketching for us, by creating a visual representation of the targets and their links. Much simpler and faster!
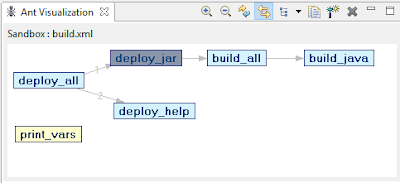
With an Ant build file open, linking the Ant Visualization view to it automatically generates a graphic of the structure.
The targets are laid out, with arrows pointing to the other targets on which one depends. Numbers show the sequence for multiple target dependencies.
The default target is colored with a grey shade. Double-click a target and its shade changes in the graph, while the editor jumps to that target and displays it.
Better still: the visualization is even more interactive than that. You can click and drag to change the layout of the visualization. If you need the image for documentation purposes, you can copy and paste it into your document, or export it as a .PNG file.
One important limitation is that it only shows targets in the open editor. Targets in imported files are not included in the visualization. That would be an essential improvement in a future release.
Summary:
How often I use it: occasional
Usefulness: medium
Star-rating (1-5): ****
Download: http://marketplace.eclipse.org/content/ant-visualization
